Metrics: Measuring What You Manage
So you know where you are today (survey, benchmarking, capability maturity assessment); where you want to go and the route you want to take (mission and strategy); you’re driving a well-tuned car for the journey (systems, processes and technology); with the right people in the right seats (organization and people).
To ensure you get to where you’re heading, on time, you need to keep track of the car’s location, direction, speed, and fuel level—and to make course corrections throughout the journey. Likewise, the modern GC uses metrics to monitor how the department is performing. As the business world likes to say, “You can’t manage what you don’t measure.”In order to be useful, the metrics framework must measure information relevant to the legal department’s business goals and objectives. In order to be practical, the scope of measurement must be proportionate to the department’s stage of operational maturity. When we help clients develop legal department key performance indicators (KPIs), we recommend focusing energy on collecting and reporting only those measures that inform management decisions or actions. Where possible they should be “forward indicators” giving visibility ahead, rather than “lagging indicators” that only look behind. To understand the whole picture, include measures of both internal and external performance—that is, collect data from within the in-house team, from customers and other stakeholders (see Fig. 14). After distilling law department performance from “anecdata” (anecdotal data) to objective KPIs, we recommend monitoring trends over time and using benchmarks to evaluate where the department stands against peers.
It is important to remember the audience; different metrics may be required by different levels of management. At the strategic level, the GC measures the overall status of the department and progress against major goals and objectives using metrics such as total legal spend as % of revenue or total legal spend per in-house headcount.
Meanwhile at the tactical level, more granular metrics help managers to measure day-to-day operations, such as cycle time to execute a contract and volume levels. And at the micro level, which fallback positions are being used most often, in order to continuously improve a contract playbook. Effective reporting generally| Productivity and efficiency | • Volumes and cycle times of various tasks • Implied cost or revenue associated with various tasks • Retention/attrition (since turnover reduces productivity and efficiency) |
| Cost and right-sourcing | • Total legal spend (as a % of total revenue) • Outside legal spend (as a % of total revenue) • Total legal spend/ in-house headcount (right in-house/ outside legal service provider balance) |
| Client and stakeholder satisfaction and engagement | • Satisfaction survey results • Unsolicited feedback (both positive and negative) • Usage of self-service tools/systems |
Fig. 14 Example KPI framework with both internal and external dimensions (Source: Elevate)
provides managers with no more than six to ten high level summary metrics and the ability to drill down to more detail levels as needed.
From a business perspective, all relevant metrics measure cost, value, or both in some fashion; where possible, they also enable budgeting and prediction. To use a simple example, metrics on litigation volumes by matter type, complexity and risk profile enable more accurate budgets. On the more sophisticated end of the spectrum, we have helped clients cross-reference litigation portfolio metrics with outside counsel spend data to create a system for selecting panel firms more cost- effectively, depending on matter type, complexity and risk.
Metrics frameworks vary depending on the operational maturity of the legal department. To be of practical use, they must focus on what is currently relevant and feasible to measure that will enable the department to progress to the next stage of development—at which point the metrics framework can be refreshed to address the new current state.
To help inform this discussion with legal departments about the ongoing evolution of metrics, we often use the same operational maturity model shown in Fig. 4, earlier in this chapter.Effective legal operations use data and metrics to manage performance against strategic goals and objectives and to inform decision-making. Smart GCs automate data gathering where possible and take advantage of new technologies that display analysis of the metrics in easy to use dashboards. Automation can reduce the human time and effort required to gather and display relevant data. Many technologies, from e-billing to contract lifecycle management tools, provide some automatic report generation. More advanced operations use centralized dashboard tools and business intelligence technologies to aggregate data from many sources (e.g., e-billing, matter management, contract management, e-signature tools, IP management, etc.), providing a unified interface for real-time reports and ad hoc analysis. See Fig. 15 for examples of Elevate's Cael Vision dashboard and reports for VMware, a technology provider of cloud and virtualization services. These dashboards have helped the VMware legal team to manage their innovative contract lifecycle management approach, including heavy use of electronic signatures (see Fig. 15c).
Regardless of the level of sophistication a legal department has reached, we encourage GCs to adopt the mantra “visibility is valuable,” because there is almost always room for material improvement. The most successful GCs know what data they have, what they need, and what they know they want but cannot yet capture (see Fig. 16) in order to drive the objectives they seek—lower cost, higher efficiency, greater predictability and better outcomes. In this context, the key to making data useful is to work towards improving the quality of it, taking incremental steps to move it from the lower right quadrant to the upper left quadrant.
Often the data from the various sources is not easy to tap into in real time, without manipulating in some way, in which case we recommend an analyst develop and document a repeatable methodology to gather and normalize the data so that the dashboards are kept up to date—there is much less value in reports that are used once a year than a live dashboard that is referred to and used proactively to make management predictions and decisions.
In one advanced example of the use of data, Intel's Business Legal group has borrowed and adapted best practices in supply chain management to create units of
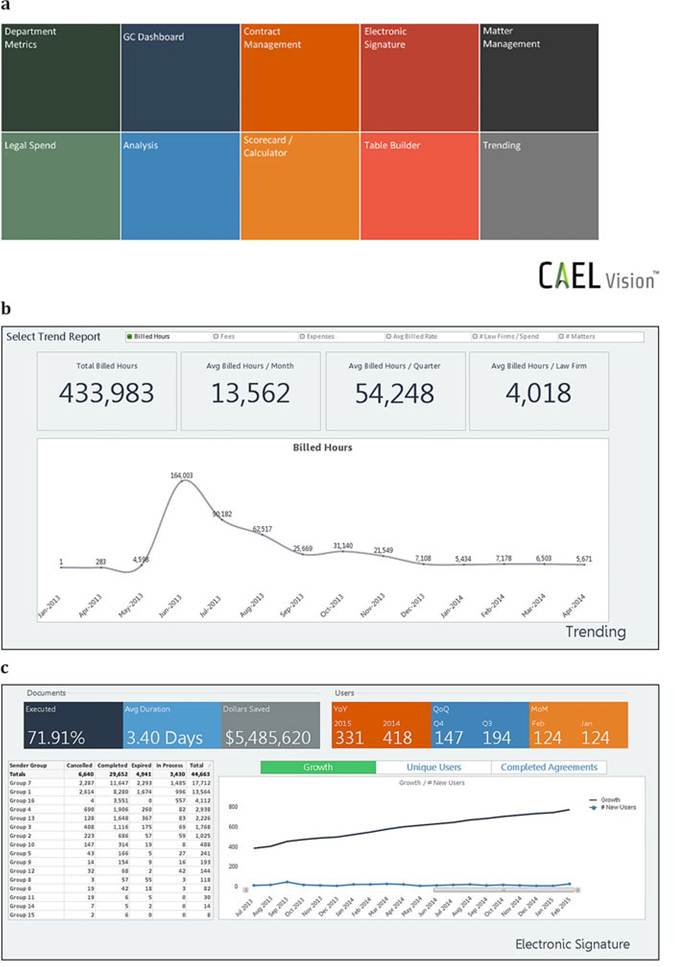
Fig. 15 Example of centralized dashboard, reporting and analysis tool (Source: VMware and Elevate). (a) Menu showing reporting and analysis areas. (b) Billed hours report. (c) Electronic signature usage report
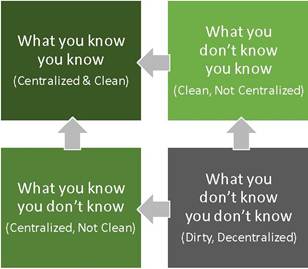
Fig. 16 Different states of data. Arrows indicate progress towards greater usefulness (Source: Elevate)
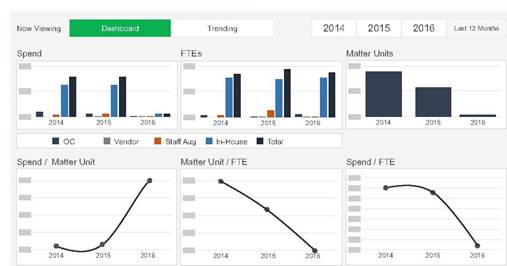
Fig. 17 Intel's legal dashboard uses supply chain best practices to measure value and identify opportunities for efficiency. Values redacted for confidentiality. (Source: Intel's Business Legal group and Elevate)
measure for the throughput of legal work. The idea—still in development—is to create units of measure for volume of work (Matter Units) and lawyer resources (FTEs), based on internal and external Spend, which will enable Intel to monitor trends such as Spend/Matter Unit. Done right, this will help Intel's legal department measure value and identify opportunities for efficiency. (See Fig. 17.)
9